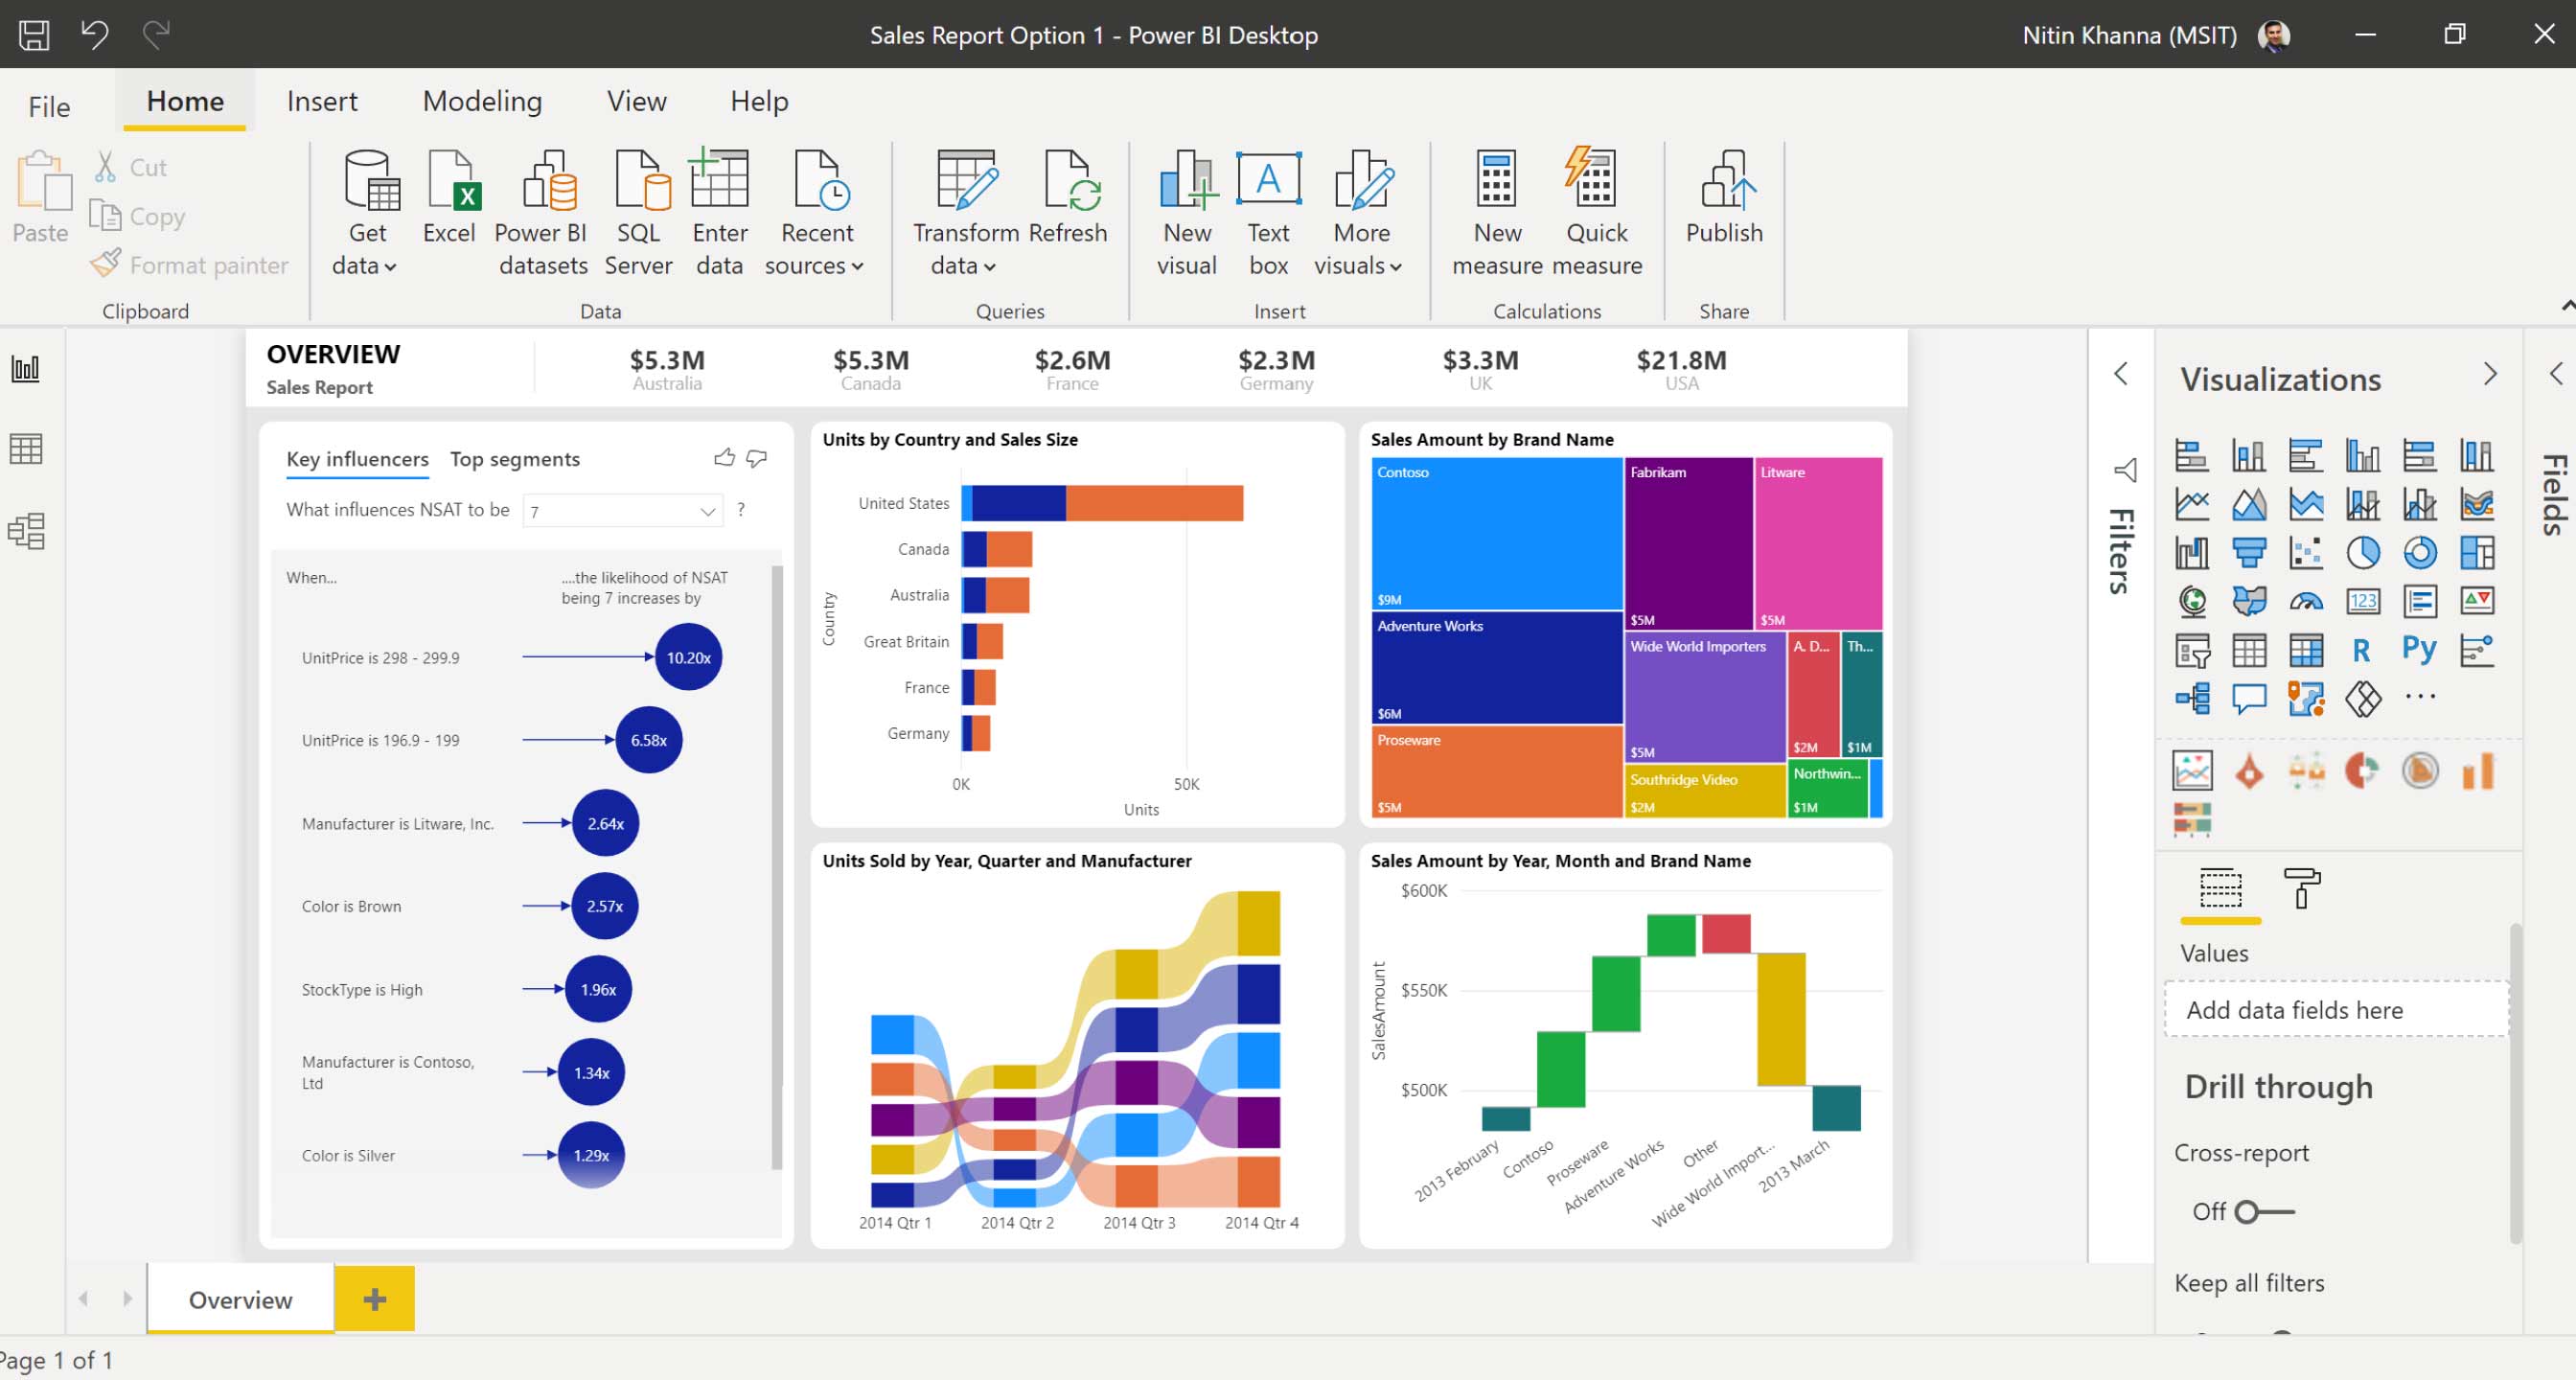
Power BI Desktop is an application that you download and install on your local computer for free. Desktop is a complete data analysis and reporting tool that you use to connect, transform, visualize, and analyze your data. It includes a query editor where you can connect to many different data sources and combine them (often called modeling) into a data model. You then design a report based on this data model. Reports can be shared with other users directly or by publishing to the Power BI service. Sharing reports requires a Power BI Pro license.
Power BI Service is it a cloud service or software as a service (SaaS). It supports report editing and collaboration for teams and organizations. You can also connect to data sources in the Power BI service, but the modeling capabilities are limited. The Power BI service is used for tasks such as creating dashboards, creating and sharing apps, analyzing and exploring your data to gain business insights, and more.

Power BI Desktop
Below are the most common use cases for Power BI Desktop.
- Connect to data.
- Transform and cleanse data to create a data model.
- Create visuals, such as charts or graphs, that provide a visual representation of data.
- Create reports that are collections of visual elements on one or more report pages.
- Share reports with others using the Power BI service.
People responsible for such tasks are often considered data analysts (sometimes called analysts ) or business intelligence professionals (often called report creators ). Many people who don't consider themselves analysts or report writers use Power BI Desktop to create compelling reports or extract data from various sources. They can create data models and then share reports with their colleagues and organizations. Power BI Desktop is updated and released monthly based on customer feedback and new features. Only the latest version of Power BI Desktop is supported; Customers who contact Power BI Desktop support will be prompted to upgrade to the most recent version.
There are three views available in Power BI Desktop, which you select on the left side of the screen. The views, shown in the order of their appearance, are as follows:
- Report: You create reports and visuals, which take up most of your time.
- Data: You see the tables, measures, and other data used in the data model associated with your report and transform the data for best use in the report model.
- Model you see and manage the relationships between tables in your data model.
Power BI Service
Power BI is a collection of software services, applications, and connectors that work together to help you create, share, and use business intelligence in ways that serve you and your business most effectively. Microsoft Power BI Service, sometimes called Power BI on the web, is a software-as-a-service (SaaS) part of Power BI. Dashboards in the Power BI service help you keep your finger on the pulse of your business. Information panels display tiles , which you can select to open reports for further study. Dashboards and reports connect to data sets , which combine all the necessary data in one place.
The other core components of Power BI are the Windows Power BI Desktop app and the Power BI mobile apps for Windows, iOS, and Android devices. You and your colleagues can use these three elements—Power BI Desktop, service, and mobile apps—to create, share, and use business intelligence.
Creating reports in the service
In a typical Power BI workflow, you start by creating a report in Power BI Desktop and then publish it to the Power BI service.
This workflow is common, but you can also create Power BI reports directly in the Power BI service.
Share your findings
Once you've created reports and dashboards, you can share them. End users of the Power BI service and mobile devices can view and interact with them. The ability to control how you share your work is one of the most important features of the Power BI service. You create workspaces where you and your colleagues can collaborate on reports and dashboards. You can then bundle and distribute them as applications. You can also share the datasets themselves so others can use them as the basis for their own reports.
Conclusion
Still have questions? If your business is planning to implement powerful Microsoft tools, just contact us. Fanetech will help you choose the best rates and use Microsoft capabilities on all 100%.

