As the variety of business intelligence (BI) and data visualization tools on the market increases, choosing the right platform to suit your budget, business goals, and team's technical expertise becomes increasingly challenging. BI tools are used to unify and visualize data; the resulting dashboards are then accessed by employees from various departments. Therefore, the chosen BI platform must be suitable for use by different teams in the organization to help them answer business questions and measure key performance indicators.
In this article, we will focus on Microsoft Power BI and Google Data Studio and compare these two business intelligence tools so that you can decide which of these BI tools is better suited to achieve your business goals. Before going into details, let's know the general information about Google Data Studio and Power BI.
What is Microsoft Power BI?
Microsoft Power BI is a data analysis and visualization tool from Microsoft. This scalable software efficiently provides high-performance data analysis for small, medium and large projects.
In the past, Power BI was widely adopted by large organizations, but in recent times, individuals and small businesses are also starting to use it due to its powerful features for analyzing data from various sources.
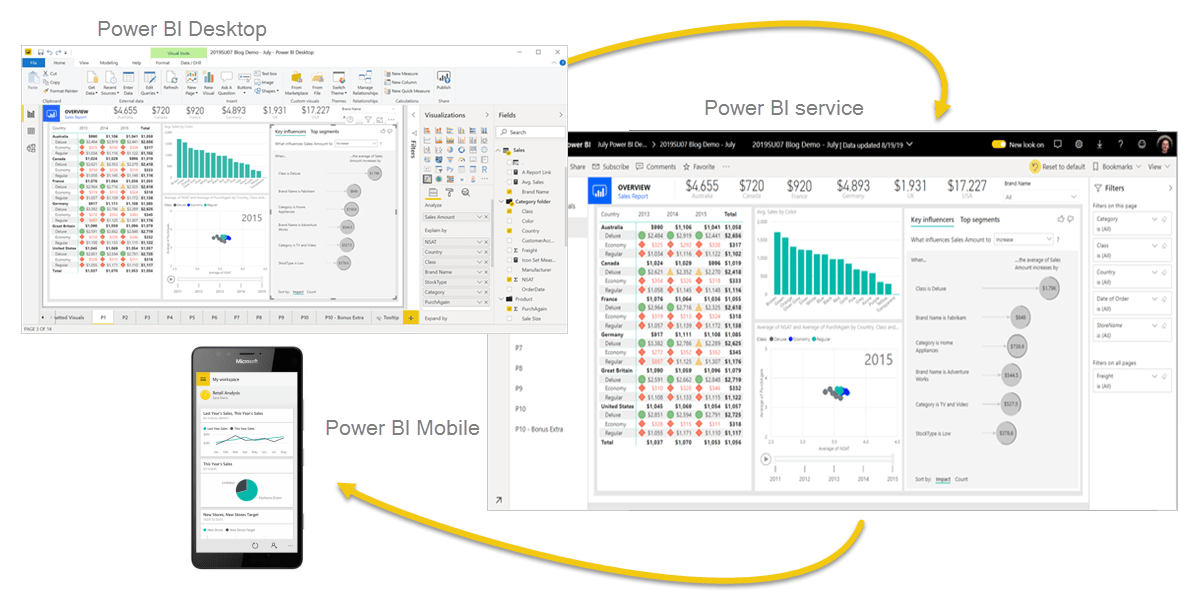
The tool has an easy to understand user interface (UI). Power BI is available as a standalone desktop app, mobile app, browser app, and on-premise server.

What is Google Data Studio?
Data Studio is an easy-to-use tool that anyone can use to create beautiful data visualizations in minutes.
It is a cloud-based application that runs on leading web browsers such as Chrome, Firefox and Safari. Data Studio also comes with a free license for personal or commercial use. You can access various charts such as bar, pie, line, scatter, etc. to enhance the visibility of your data reports.
In addition, the navigation of the software is similar to Google Drive and Google Docs. Therefore, you don't need to spend a lot of time getting familiar with the interface.
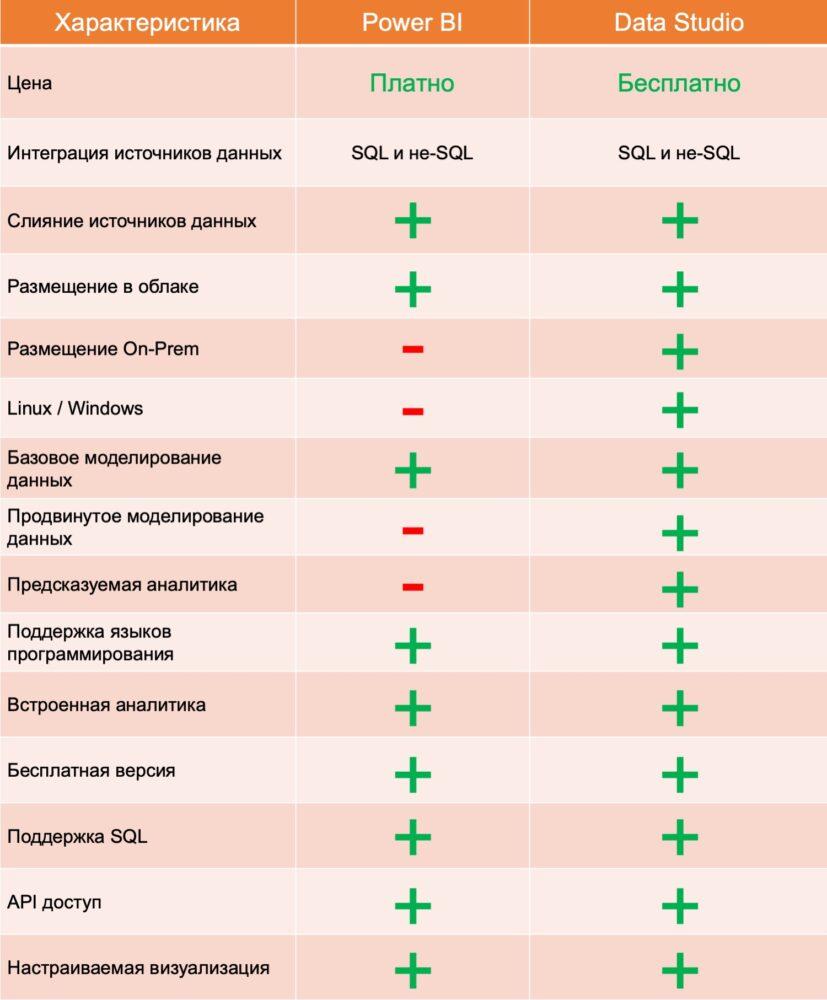
Google Data Studio and Power BI: Comparison Table
Before we dive into details, let's take a look at the table below to compare the features of Google Data Studio and Power BI.

1. Google Data Studio and Power BI: price
What is Google's pricing structure?
Google Data Studio is currently free for all users. All you need is to sign up for a Google account.
What is the Power BI pricing structure?
Microsoft Power BI offers users 3 pricing options:
Power BI Pro: License individual users to visualize data with interactive dashboards and reports, and share information within the organization.
Power BI Premium Per User: License individual users to accelerate access to AI-powered analytics and simplify data management and access.
Power BI Premium Per Volume: This option is similar to Power BI Premium Per User, but with this option you have no limit on the number of users. This option is suitable for organizations that have many Power BI users.
2. Google Data Studio and Power BI: integration with data sources
How does data integration work in Google Data Studio?
Types of Data Sources
Since Data Studio is a Google product, there are various built-in integrations with sources such as Google Analytics, Google Ads, Google Sheets, BigQuery, Cloud Storage and many more. Plus, there are over 400 partner integrations available that let you connect to data sources like Adobe Analytics and Facebook. Note that unlike many other BI tools that require a connection to a SQL data source, Google Data Studio can connect to both SQL-based and non-SQL data sources.
Merging Data Sources
Some of you may be asking: Is it possible to combine different data sources into a dashboard to create tables and graphs? The answer is yes. Google Data Studio has an option called data blending, which is an external join that allows you to create charts based on multiple data sources. You can mix up to 4 sources.
How does data integration work in Microsoft Power BI?
Types of Data Sources
Power BI integrates with over 100 data sources, both SQL and non-SQL. Generally, we can divide Power BI data sources into 2 types:
Files: Files refer to data sources such as PDF, Excel, JSON, Google Analytics, Adobe Analytics, etc.
Databases: Databases refer to data sources that are typically SQL-based, including BigQuery, Amazon Redshift, Azure MySQLm Database, and more.
Merging Data Sources
In Microsoft Power BI, you can use the Add Queries or Merge Queries features to combine data sources.
The append operation creates a new query containing all the rows from the first query, followed by all the rows from the second query. The add operation requires at least two requests. This is similar to the outer join operation in a SQL database. On the other hand, a merge request creates a new request from two existing requests. A single query result contains all the columns from the primary table, with one column serving as the only column that contains the relationship to the secondary table. The linked table contains all the rows that match each row from the main table based on the overall value of the column. This is similar to the join operation in a SQL database.

3. Google Data Studio and Power BI: Deployment
What deployment options does Google Data Studio offer?
Currently, Google Data Studio (GDS) only offers access to the platform through a browser (entirely hosted in the cloud). This means you need to connect to the internet and open GDS with a Google account. The dashboards you create will be saved and can be accessed while you're online.
What deployment options does Microsoft Power BI offer?
In terms of deployment, Power BI offers 3 main options:
Power BI Service: the solution runs in the cloud and provides fully hosted reports.
Power BI Report Server: The solution is designed for users with more stringent security requirements because it allows you to host Power BI on your own server.
Power BI Embedded: This option is part of the Power BI service and allows you to use the API to embed reports in various applications.
4. Google Data Studio and Power BI: data analysis capabilities
What are the analytical capabilities of Data Studio?
Predictive/Advanced Analytics
Unlike many other BI and data analytics tools on the market, Google Data Studio doesn't have any significant predictive analytics capabilities that allow you to do things like time series forecasts. So, in some ways, the lack of this feature may make Google Data Studio an unsuitable tool for those companies that use forecasting functions.
Programming language support
The tool does not natively support languages such as Python and R. However, there are third-party tools such as Panoply that allow users to integrate R and Python with Data Studio. Alternatively, you can use Google Sheets, which is updated using Python, and connect it to Data Studio. This solution is more suitable for small data sets. For large sets you can use BigQuery.
Built-in analytics
You can embed the report into any website or application that supports HTML iframes. No HTML knowledge required. The embedded report is displayed in view mode (viewers cannot edit the report).
What are the analytics capabilities of Microsoft Power BI?
Predictive/Advanced Analytics
Power BI offers different analytics features for different use cases. Below are some of the most popular ones:
1. Clustering methods
2. Time series analysis
3. Function analysis
4. Custom Advanced Analytics Visuals
5. Quick conclusions
6. AI analytics
Programming language support
Power BI supports multiple programming languages for ingesting, transforming, visualizing, and analyzing data:
1. Data Analysis Expressions (DAX)
2. Multidimensional Expressions (MDX)
3. Power Query Formula Language (informally known as “M”)
4.SQL
5. R
6.Python
Built-in analytics
Power BI embedded analytics comes in two solutions:
1. Embedding for your clients. The Customer Embed solution lets you create an app that uses Power BI authentication.
2. Implementation for your organization. The enterprise embed solution allows you to create apps that require you to sign in with your Power BI credentials.
Conclusion
In this article, we analyzed the key aspects of Google Data Studio and Microsoft Power BI so that you can make a more informed decision when choosing a business intelligence and data visualization tool for your organization.
To sum it up, Data Studio is suitable for organizations that are not yet sure about their BI strategy. Because it is a free tool and hence the investment is minimal. GDS also has a variety of data source connectors (mostly Google products), and you can even create your own connector if you can't find what you need. Data modeling in Data Studio is limited and primarily supports calculated fields. It also does not support predictive analytics initiatives. Overall, Data Studio is a good solution if you mainly want to focus on creating simple and interactive dashboards and don't require complex modeling and operations.
Power BI, on the other hand, has comprehensive data modeling features that are suitable for organizations that want to define data relationships between different tables in data sources. It also offers advanced analytics capabilities, allowing organizations to gain deeper insights into their data. Power BI has more flexible deployment options than Data Studio, but is a paid solution. So, if you want a flexible business intelligence platform that supports advanced data modeling and analytics use cases, and don't mind spending the money, Power BI is your choice.
Still have questions?
If you decide to choose Power BI for your company and still have questions about integrating the Microsoft solution, just contact us. At Fanetech, we customize Microsoft solutions to suit business needs.

